What is TRANSOL?
Transol is a tool for design, calculation and optimization of solar thermal systems. Transol makes dynamic simulation easy (TRNSYS engine) through a user-friendly interface. This tool comes from an ambitious project developed by AIGUASOL and the French research center CSTB (Centre Scientifique et Technique du Bâtiment) and started in 2004.
Why use TRANSOL in design of solar thermal systems?
For practical purposes, most of the solar thermal installations are sized according to the known F-Chart method, for practical reasons, economic and historical. We would like to highlight some inconsistencies of this habit.
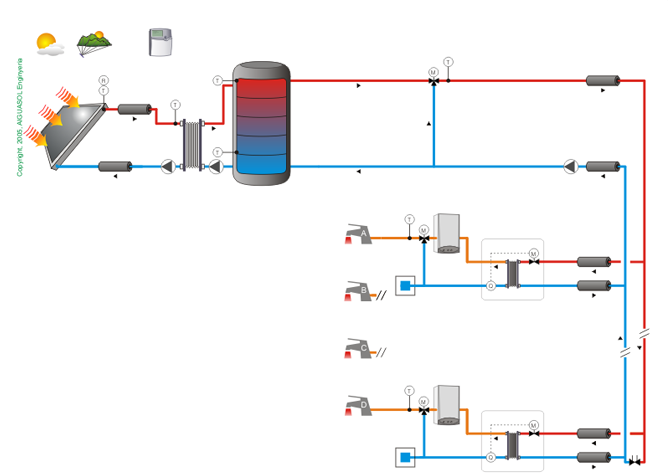
We will not explain in detail the F-Chart method, but basically it consists on 300 TRNSYS simulations of a solar thermal system model that responds to the following hydraulic system:
And adjusting the simulation results by least squares to calculate curves that allow the expected system solar fraction.
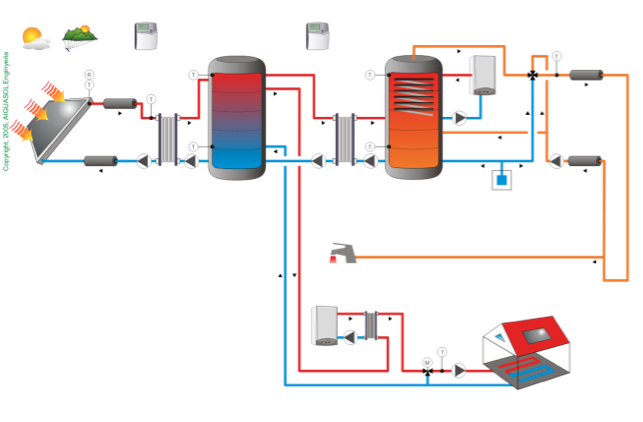
However, the solar thermal energy market works in a great diversity of system configurations, for example:
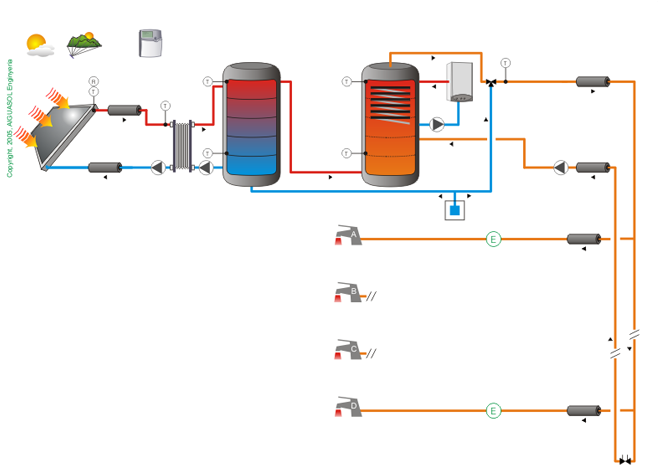
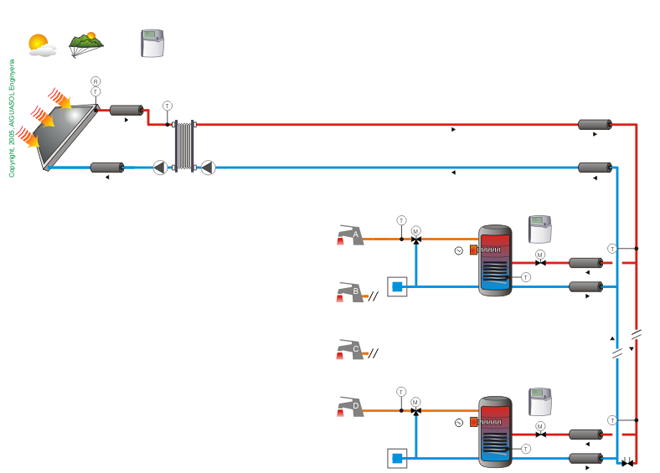
If we use this method of calculation, we observe the same behavior on the three schemes above. Clearly, this is not true, and also easily demonstrable.
TRANSOL is also based on TRNSYS models, but instead of a single configuration, as in F-Chart, includes about 40 system configurations, allowing more than 140 system variations.
As a simple example, the following graph compares solar fraction for the previous three configurations according to F-Chart vs TRANSOL.
(First column – FChart, following columns – each different system in TRANSOL: SCH_CEN – Centralized, SCH_DC – Decentralized, SCH_SC – Semi-centralized)
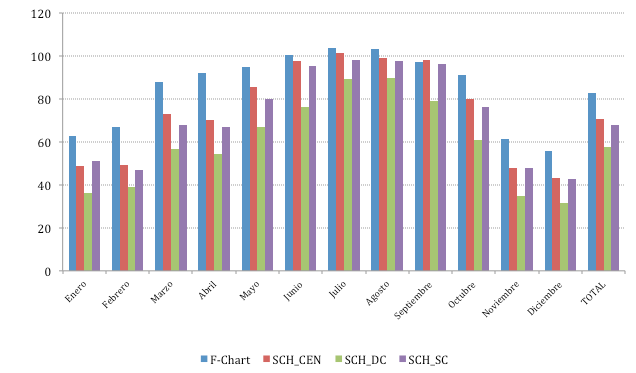
According to F-Chart method, the three schemes are equivalent, so the solar fraction is in all cases 83%. To achieve a solar fraction of 71%, 13 m² collector suffice with F-Chart.
Why these differences?
The answer is simple, just briefly review F-Chart methodology to find the answer. The F-Chart method is used arbitrarily outside its range of validity. Let’s review some of the most relevant assumptions:
Configuration
We have already mentioned that the F-Chart method is based on a TRNSYS model of a single system configuration, and should not be extrapolated to other configurations without a justification.
Demand
According to F-Chart, the value of the DHW (Domestic Hot Water) demand is between 140 and 560 kg / day. This does not mean it is not accurate outside this range, but the further from our system the less accurate this value may be.
Solar Collector
The collector is assumed to be flat (Flat Plate Collector), thus its optical performance is characterized as such. This is severe in case of using evacuated tube collectors and other different optical behaviors, since F-Chart underestimates this phenomenon, which can lead to systematic stagnation problems in system operation.
Setup Control
F-chart assumes that temperature sensor in solar collector and solar storage tank never reach the maximum value. This may be true for Madison, Wisconsin (near the Canadian border that is used to deduce the location of the F-Chart method), and collector technology in 1975, but for high solar fractions and locations with higher solar resources is, at least, a risky hypothesis.
CONCLUSION
In short, the F-Chart method is not wrong, designers should limit its use to the operating conditions for which it was developed. It gives collectors surface to install, but does not evaluate the energy savings associated with an installation. If sector actors themselves are not able to determine energy savings achieved, they will hardly expand its niche in the increasingly necessary CO2 emission reductions looming.
Therefore, one might wish that the calculation method would serve not only to determine whether a regulation is complied (we have seen that, technically, F-Chart is not able to do so in most of the situations), but also to help designers sizing solar systems in order to maximize the solar contribution and minimize CO2 emissions.